
Heat Acclimatisation

Dash turns recent activities with reliable temperature data into a practical estimate of heat acclimatisation. The score builds as qualifying exposure accumulates, decays when it stops, and links back to the sessions behind the change.

  • A 0–100 score with recent trend and contributors.
  • Activity weather or recorded ambient temperature when available.
  • Dedicated views in Dash and on the Home Screen.

A training estimate—not medical advice, a diagnosis, or a readiness verdict.

Achievements

Achievements brings notable performances into one place across running, cycling, swimming, walking, and hiking—so a strong session does not simply disappear into a list.

  • Medals call out notable recent performances.
  • All-time and annual views add context.
  • Distance milestones make long-term progress visible.

Training Load

Fitness, Fatigue, and Form live on one chart, with the activities contributing to each day close at hand. The chart is useful because Dash gives you a way back to the work that moved it.

  • Longer-term fitness and fast-moving fatigue together.
  • Form shows the balance between the two.
  • Power or heart-rate signals selected from usable activity data.

Context for your training—not a training prescription.

Themes

Themes change the character of Dash without changing what the widget tells you. The original Dracula, Nord, and Solarized spotlight has grown into a much broader appearance library.

  • One appearance across widget families.
  • Preview themes inside Dash before choosing.
  • The same clear hierarchy across every look.
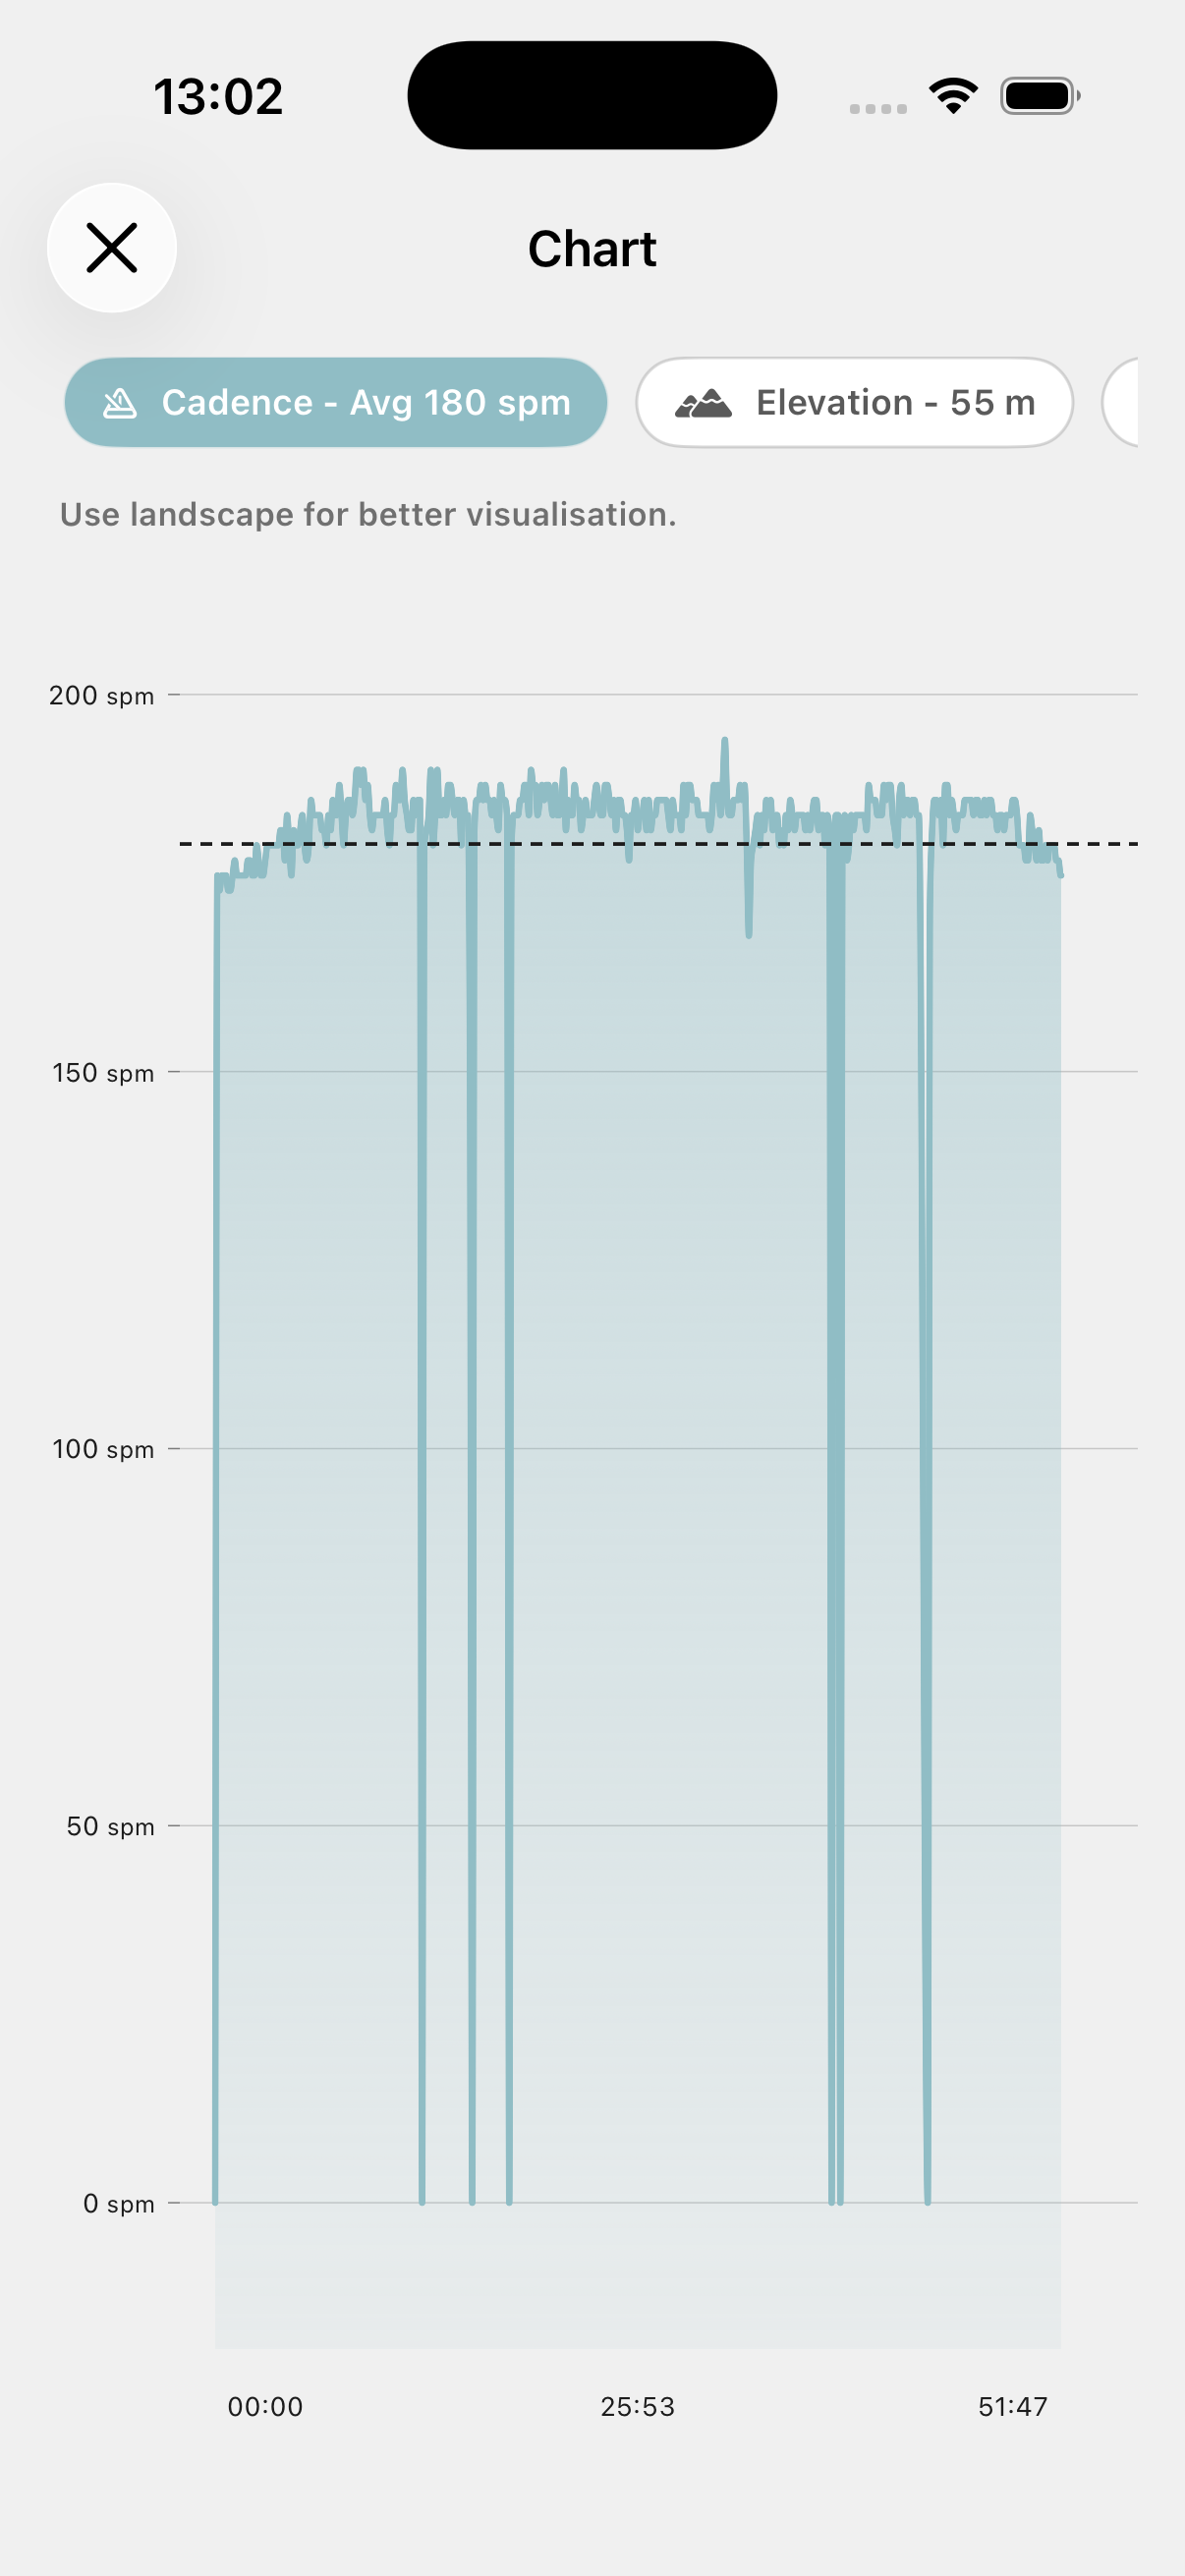
Cadence chart in a Dash activity detail view

Cadence

Average cadence hides the shape of an activity. Dash charts the stream itself: steps per minute for run-like activities and revolutions per minute for rides.

  • spm for running and walking; rpm for cycling.
  • Visible when cadence stream data is available.
  • Aligned with the activity timeline for comparison.
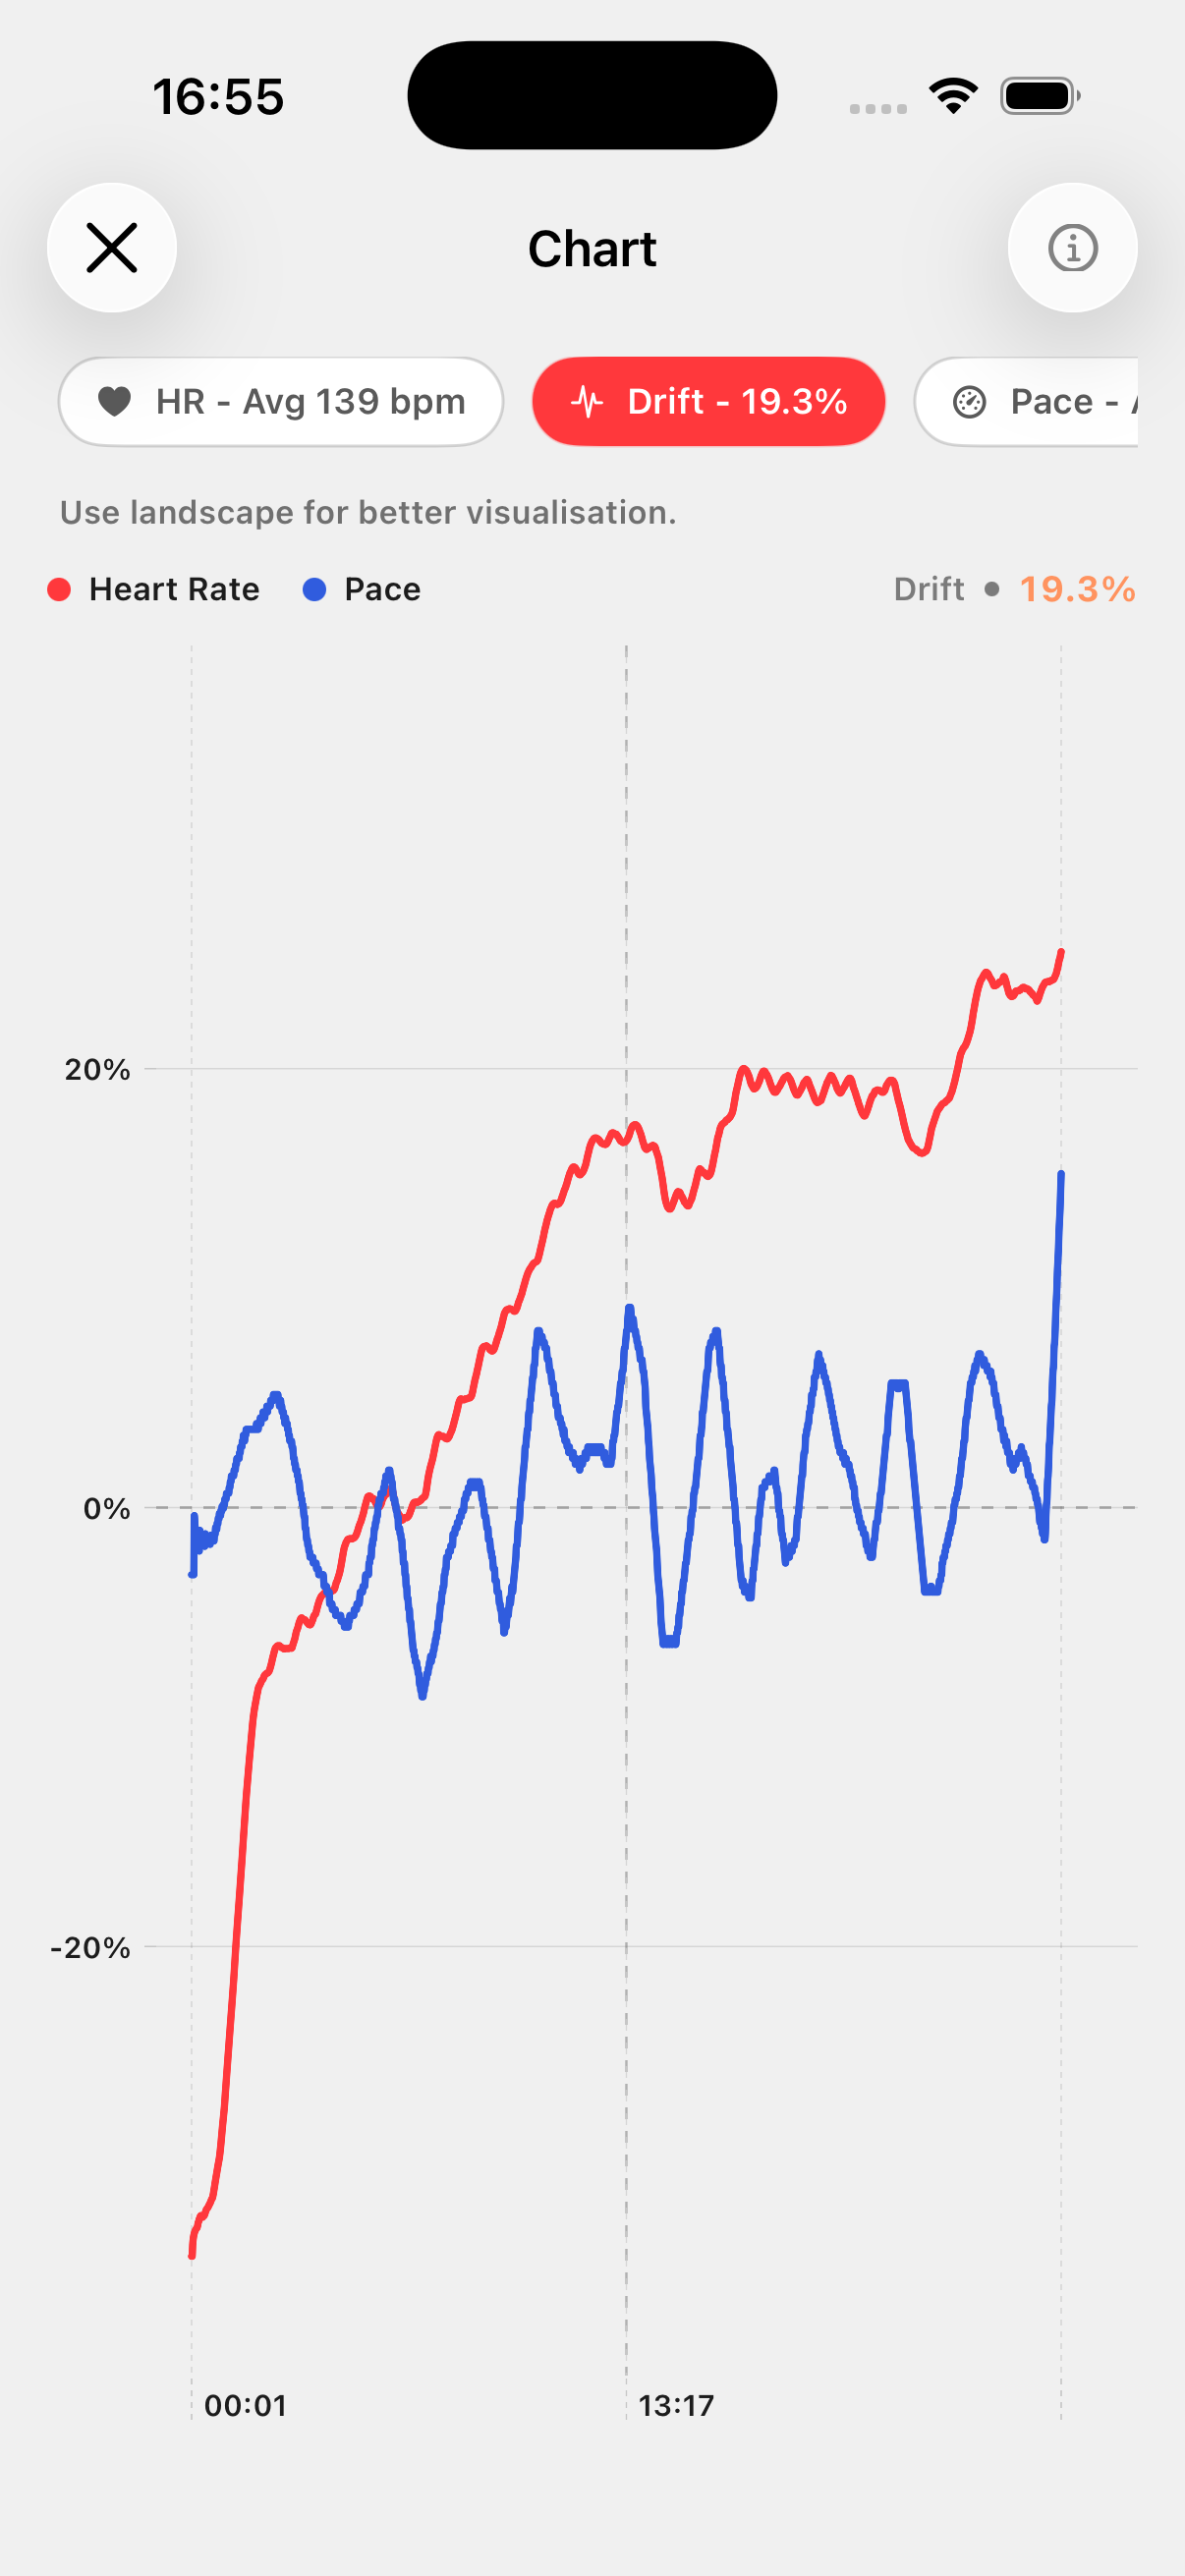
Heart rate and pace trend chart in Dash

Heart Rate Drift

Heart Rate Drift compares the first and second halves of a sustained effort. Dash makes it easier to see when heart rate rises while pace or power remains relatively stable.

  • Heart rate against pace for runs or power for rides.
  • The underlying trends, not only one percentage.
  • Kept inside the activity where the signal occurred.

Descriptive training data—not a diagnosis. Conditions, sensors, terrain, hydration, and pacing can all affect the result.

Your training deserves a better glance.

Dash brings the metrics you care about to the Home Screen, Lock Screen, and a focused app built for going deeper.

Download Dash on the App Store