 Training guide
How to compare weekly, monthly, and yearly training.
Short answer: compare equivalent calendar periods for the same activity, then read distance, duration, activity count, and one sport-specific metric together. The percentage changes tell you what moved; the underlying totals tell you whether that change matters.
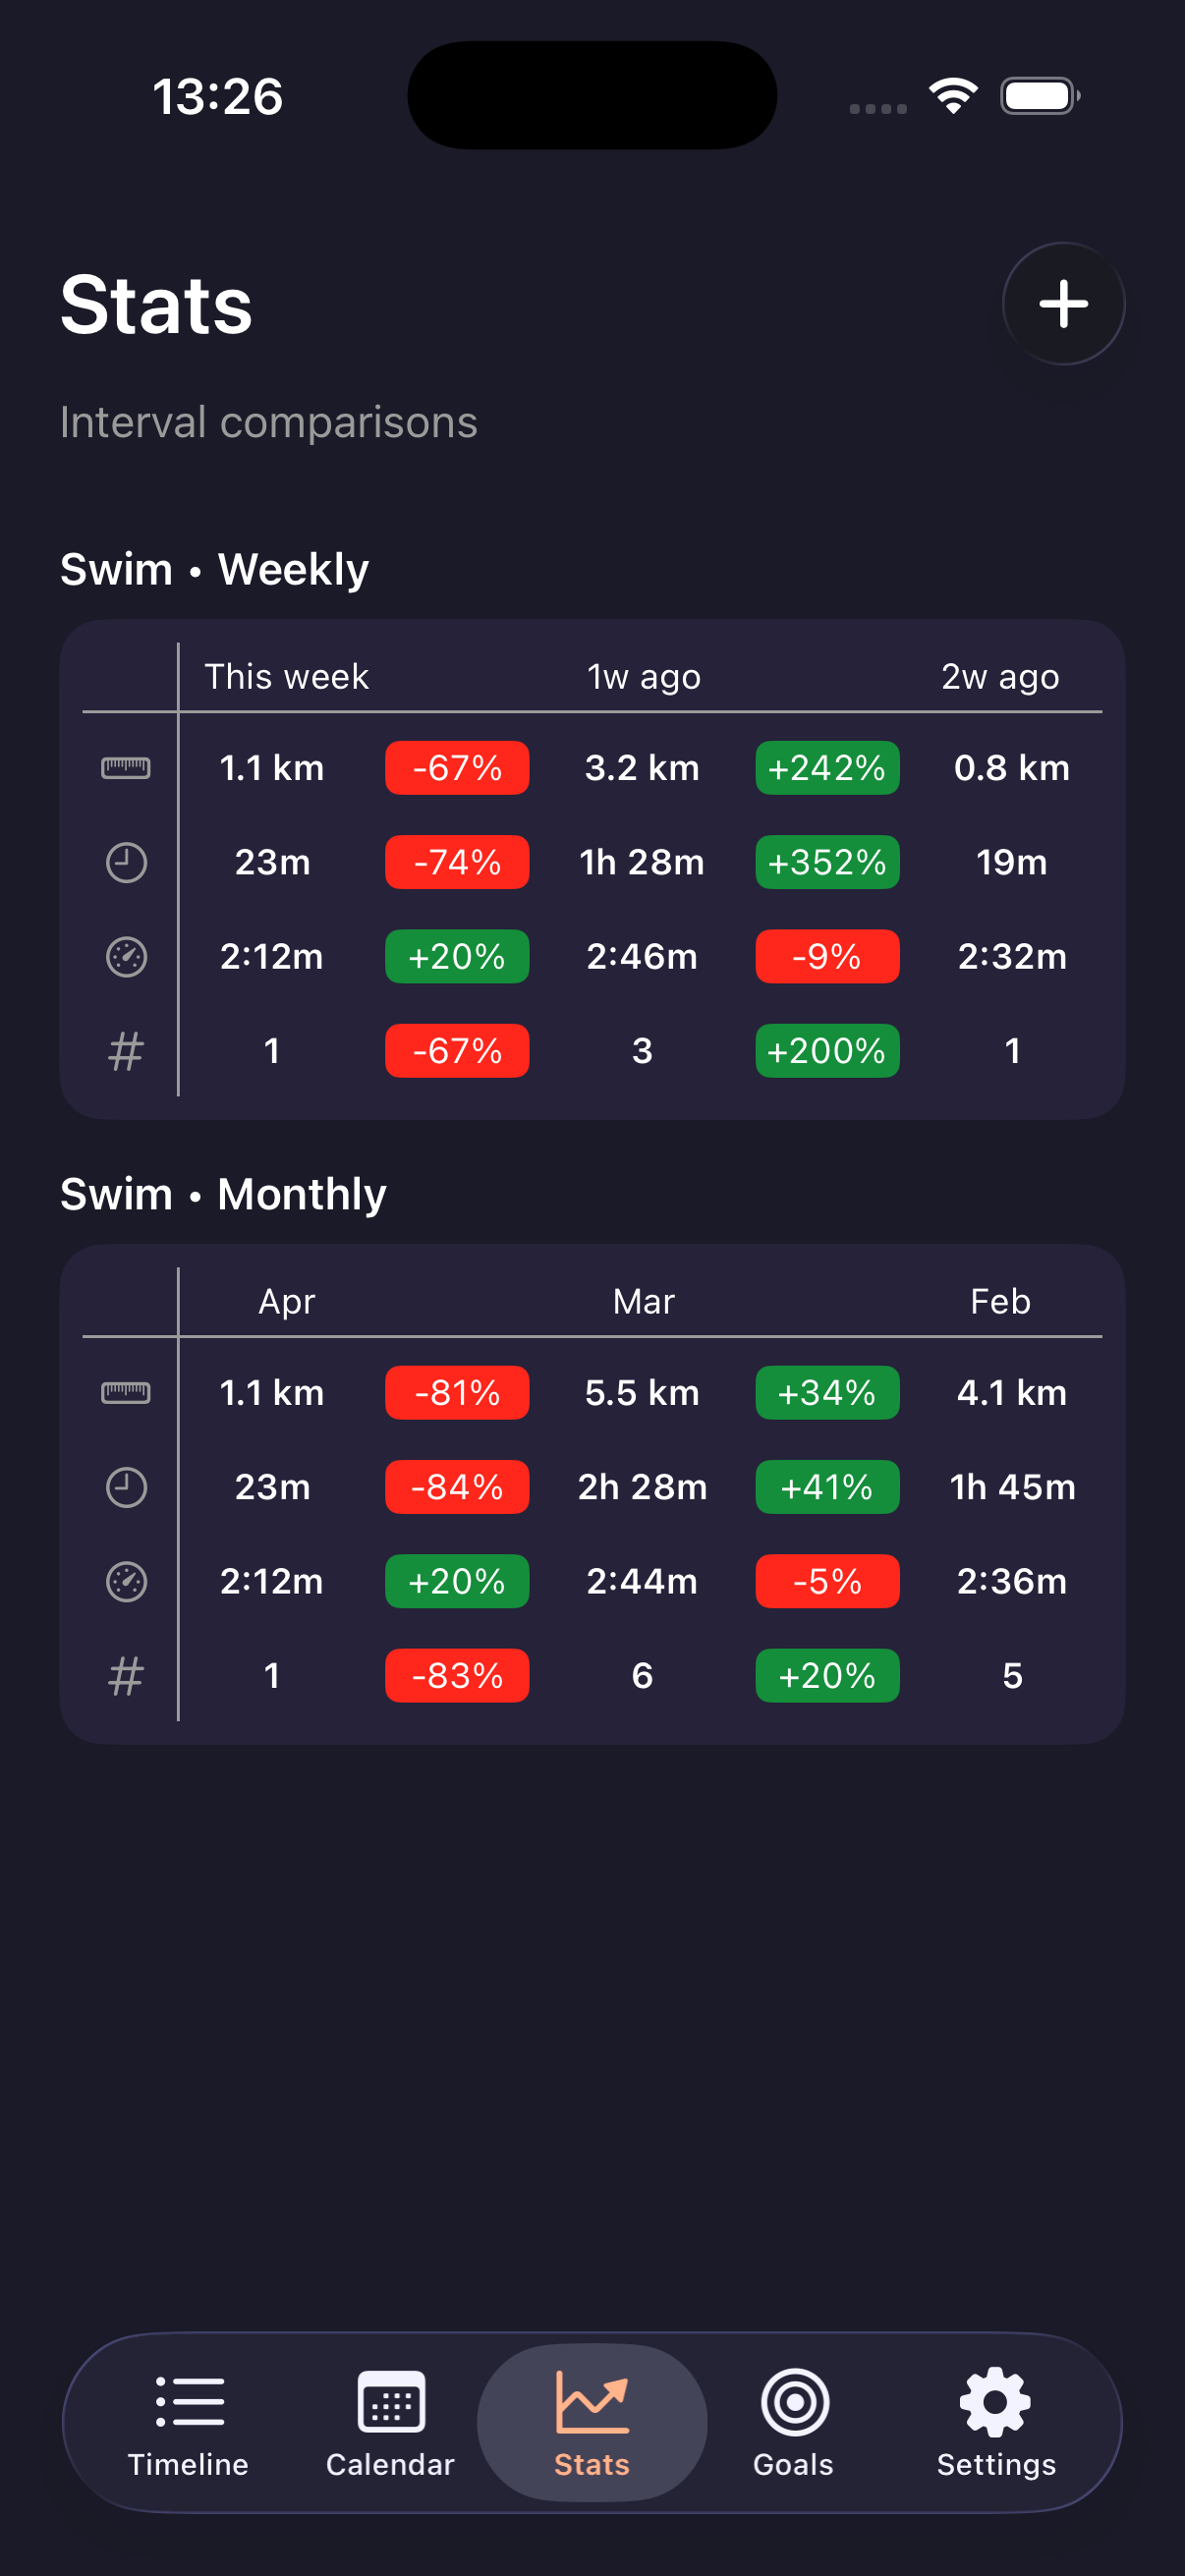

1. Compare like with like
Start with one activity type and one calendar interval. Compare running with running, swimming with swimming, or all activities with all activities. A week-to-week comparison is useful only when both columns represent equivalent weeks; the same rule applies to months and years.
Dash shows the current period beside the previous periods, so you can see the totals and the percentage change without rebuilding the comparison yourself.
2. Read the four numbers together
Distance alone rarely explains a training block. Check duration and activity count beside it, then use the activity-specific metric for extra context. That might be elevation for hiking, pace for swimming, speed for skiing, or calories for another activity type.
For example, higher distance with the same number of activities means your average session became longer. More activities with similar total duration points to shorter, more frequent sessions. Neither pattern is automatically better; they answer different questions.
3. Use the right time scale
Weekly
Best for recent consistency, sudden changes, and the shape of your current routine.
Monthly
Best for seeing whether a training block actually changed your overall volume or frequency.
Yearly
Best for seasonality, long-term habits, and comparing broad training phases.
4. Treat percentages as a prompt, not a verdict
A large percentage change can come from a very small baseline. Moving from one activity to two is a 100% increase, but the useful fact is still that you completed one extra activity. Read the percentage beside the absolute distance, duration, and count.
Comparisons also reflect the activity and step data available in Dash. Missing or newly imported data can change the picture, so use the numbers as context for your training rather than a prescription.